« Opportunities | Main | A Local Lecture »
Friday, October 09, 2009
Stock Market
As an investor, I carefully watch the market and look for data and information of value in valuing stocks. I've concluded, as many others have, that the stock market and individual stock prices move in unpredictable ways in the short term. But over time, there seems to be some basis for the pricing.
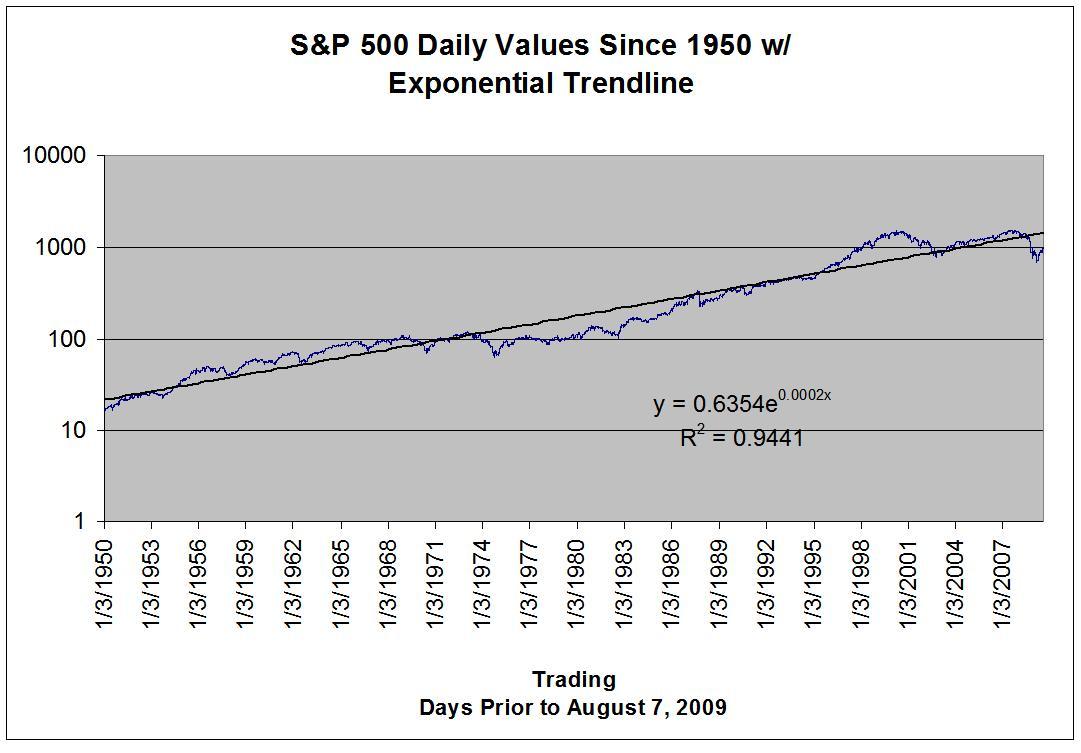
For example I collected the daily prices for the S&P 500 index from Yahoo! They have data going back to 1950! Plotting the prices on a logarithmic scale versus time on a standard scale I see a trend. In fact, the data correlates to a straight line with 0.94 fit factor! The slope is 7.8% increase per year. Note that inflation over the same time period is 2.7% (thanks to usinflationcalculator.com) but does not fit a trend line that I can see. So inflation adjusted return over that time period is 5.1%.
Comparing the S&P data versus the trend line yields some interesting observations.
- The mid 1950's to about 1970 had prices generally above the trend line
- The mid 1970's through about 1990 had prices generally below the trend line
- The "bubble" of the late 90's is very evident
- It now appears we're in what Ken Fisher calls a "reverse bubble" - the S&P could go up 50% just to make it to the trend line!